Laser Scanning Range
To see more on shadowing click here.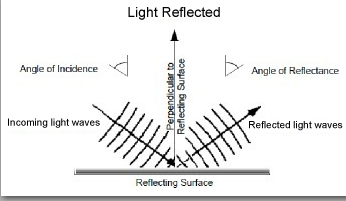
The Disadvantage. We are often asked how laser scanning range affects the mobile laser scanning system (i.e. ScanLook). In particular, ScanLook utilizes the FARO FOCUS 3D (F3D) with an advertised distance of 120m for the 120 and 330m for the X330 and the Velodyne HD32 with a distance of 70 to 100m (depending upon the literature).
The FOCUS Success. Let’s step back for a moment and evaluate the F3D from a static scanning perspective. Up until October 2010 FARO was virtually unknown to surveyors and mappers. Since that time the F3D has completely dominated the static scanning market. Its range is much less than that of many of its competitors yet it has yielded an unexpectedly high volume of sales. This can only mean that the range is either not that important or there is something else being overlooked. The initial reaction by many speculators was that it was too small, light, and fragile with a short scanning range. Apparently they were wrong. Sure, the price is drastically reduced but that’s nothing new. There are other systems available for much less and yet they don’t have near the appeal. If the F3D was a fad, it would have passed by now. We can only assume then that users are buying the F3D and making a profit using it. The range must be significant and competitive in some markets.
Traversing & Surveying. Thinking as a surveyor using a total station, distance is important. It makes a big difference in traversing. While traversing, the longer the legs of each traverse side the quicker the job can be finished. In addition, a total station can be used for topographic collection. In this case, the rod-man must walk to each distinct point to collect the XYZ data and other attributes. The more information necessary, the longer it takes at each station. If the traverse stations are set far apart, then not only does the time increase to collect the topography but so does the difficulty obtaining line-of-sight to all data necessary. Often this requires additional setups with the total station (and level).
It would be foolish in most cases to use a static scanner simply for traversing. It can be done but it would be painfully slow. Scanning is done to capture the 3D environment. Traversing just happens to be part of the workflow to join each setup into a seamless result. The fame that the F3D has is it can do short legged setups very, very fast with a light instrument so it’s not burdensome in the field. At each setup everything within a 100 to 150 feet radius is captured.
Some manufacturers have much greater range scanners but can they scan down a roadway or through a neighborhood faster? Not usually. The reason is influenced largely by the instrument height, the angle of incidence, and the lack of line of sight to all areas of interest. At about 5.5 feet instrument height the angle of incidence quickly degrades with distance as seen in this table:
| Ht 5.5 | ||||||||||
|---|---|---|---|---|---|---|---|---|---|---|
| Distance | 50 | 100 | 150 | 200 | 250 | 300 | 350 | 400 | 450 | 500 |
| Delta Dist | 49.93 | 99.71 | 149.36 | 198.86 | 248.23 | 297.45 | 346.54 | 395.48 | 444.29 | 492.96 |
| GSD | 0.07 | 0.29 | 0.64 | 1.14 | 1.77 | 2.55 | 3.46 | 4.52 | 5.71 | 7.04 |
| Inc Ang | 83.72 | 86.85 | 87.90 | 88.42 | 88.74 | 88.95 | 89.10 | 89.21 | 89.30 | 89.37 |
And at 7.5 feet:
| Ht 7.5 | ||||||||||
|---|---|---|---|---|---|---|---|---|---|---|
| Distance | 50 | 100 | 150 | 200 | 250 | 300 | 350 | 400 | 450 | 500 |
| Delta Dist | 49.95 | 99.79 | 149.53 | 199.16 | 248.70 | 298.13 | 347.45 | 396.68 | 445.80 | 494.82 |
| GSD | 0.05 | 0.21 | 0.47 | 0.84 | 1.30 | 1.87 | 2.55 | 3.32 | 4.20 | 5.18 |
| Inc Ang | 81.47 | 85.71 | 87.14 | 87.85 | 88.28 | 88.57 | 88.77 | 88.93 | 89.05 | 89.14 |
And at 10.5 feet:
| Ht 10.5 | ||||||||||
|---|---|---|---|---|---|---|---|---|---|---|
| Distance | 50 | 100 | 150 | 200 | 250 | 300 | 350 | 400 | 450 | 500 |
| Delta Dist | 49.96 | 99.85 | 149.66 | 199.40 | 249.07 | 298.66 | 348.18 | 397.62 | 446.99 | 496.29 |
| GSD | 0.04 | 0.15 | 0.34 | 0.60 | 0.93 | 1.34 | 1.82 | 2.38 | 3.01 | 3.71 |
| Inc Ang | 78.14 | 84.01 | 86.00 | 86.99 | 87.59 | 88.00 | 88.28 | 88.50 | 88.66 | 88.80 |
Not only does the angle of incidence approach 90 degrees giving less reliable results but the GSD (or the distance between samples in this case) becomes larger as well. In static scanning points nearer the instrument are generally much denser than those 100 feet from the scanner. Just how far away from the scanner is reasonable to scan before the sampling distance is insufficient in spacing and quality?
One more thing, line of sight in relation to the ground is even a bit trickier than for poles, buildings, etc. The ground undulates so as the distance increases from the scanner, dips and ditches, mounds and humps, etc., become much less likely to be included in the data resulting in shadowing, or voids. Hence, more setups, better coverage.

Range is important. This is absolutely true when scanning across rivers, tall structures, across open pits or mines, to areas that are otherwise inaccessible from the ground. The FARO X330 can scan to ranges greater than 330 meters, but for ranges exceeding much more than this either a longer range scanner is required or a UAV, helicopter, or gyroplane (maybe a boat) carrying Snoopy.
Mobile Scanning. How does all of this apply to mobile scanning? It is almost exactly the same. The angle of incidence, the lay of the land (ditches), the sampling distance and density, the reliability, instrument height – these all affect the actual, reliable scanning range. ScanLook using the F3D can provide the best scan data available on a mobile platform for near range, hard surface areas. This is primarily concerned with pavement, curb and gutter, engineering and surveying grade work. For assets and mapping grade data ScanLook employs the Velodyne HD32. Its range is effectively 70 to 80 meters and at several centimeters precision. In almost all of the scanning we have done we cannot realize this distance in scanning for a very simple reason – obstructions. Most roadways have buildings, fences, or greenery within 50 to 100 feet from the road. Because Snoopy is small and light, mounting high above the vehicle allows us to scan quite high to minimize shadowing in ditches, over fences, etc. In this case being a light system is important.
Lastly, hire a (local) competitor with a $1M system for the few times you need to reach this distance.